
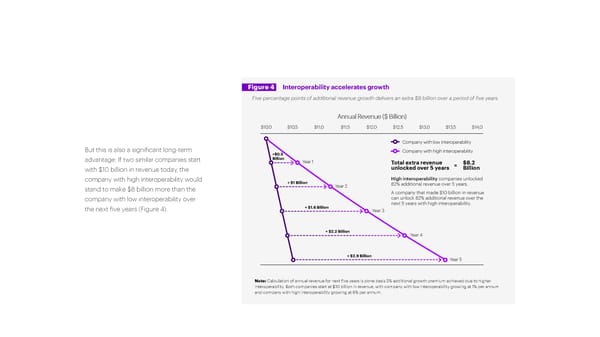
Figure 4 Interoperability accelerates growth Five percentage points of additional revenue growth delivers an extra $8 billion over a period of five years. Annual Revenue ($ Billion) $10,0 $10,5 $11,0 $11,5 $12,0 $12,5 $13,0 $13,5 $14,0 Company with low interoperability But this is also a significant long-term +$0.5 Company with high interoperability advantage: If two similar companies start Billion Year 1 Total extra revenue $8.2 with $10 billion in revenue today, the unlocked over 5 years = Billion company with high interoperability would + $1 Billion High interoperability companies unlocked stand to make $8 billion more than the Year 2 82% additional revenue over 5 years. A company that made $10 billion in revenue company with low interoperability over can unlock 82% additional revenue over the + $1.6 Billion next 5 years with high interoperability. the next five years (Figure 4). Year 3 + $2.2 Billion Year 4 + $2.9 Billion Year 5 Note: Calculation of annual revenue for next five years is done basis 5% additional growth premium achieved due to higher interoperability. Both companies start at $10 billion in revenue, with company with low interoperability Note: Calculation of annual revenue for next five years is done basis 5% additional growth premium achieved due to higher growing at 1% per annum and company with high interoperability growing at 6% per annum. interoperability. Both companies start at $10 billion in revenue, with company with low interoperability growing at 1% per annum and company with high interoperability growing at 6% per annum.
 Full Report Page 11 Page 13