
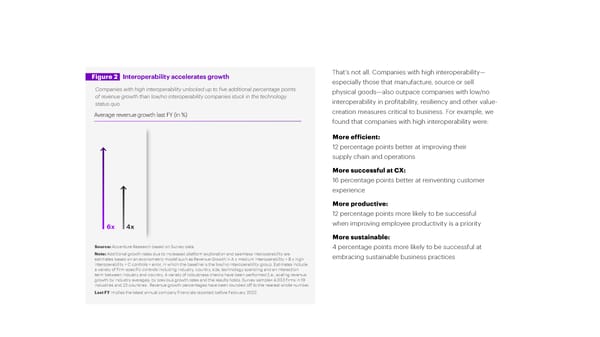
Figure 2 Interoperability accelerates growth That’s not all. Companies with high interoperability— especially those that manufacture, source or sell Companies with high interoperability unlocked up to five additional percentage points physical goods—also outpace companies with low/no of revenue growth than low/no interoperability companies stuck in the technology interoperability in profitability, resiliency and other value- status quo. Average revenue growth last FY (in %) creation measures critical to business. For example, we found that companies with high interoperability were: More efficient: 12 percentage points better at improving their supply chain and operations More successful at CX: 16 percentage points better at reinventing customer experience More productive: 12 percentage points more likely to be successful 6x 4x when improving employee productivity is a priority More sustainable: Source: Accenture Research based on Survey data. 4 percentage points more likely to be successful at Source: Accenture Research based on Survey data. Note: Additional growth rates due to increased platform exploration and seamless interoperability are Note: Additional growth rates due to increased platform exploration and seamless interoperability are estimates embracing sustainable business practices estimates based on an econometric model such as Revenue Growth i= A x medium interoperability + B x high based on an econometric model such as Revenue Growth i= A x medium interoperability + B x high interoperability interoperability + C controls + error, in which the baseline is the low/no interoperability group. Estimates include + C controls + error, in which the baseline is the low/no interoperability group. Estimates include a variety of a variety of firm-specific controls including industry, country, size, technology spending and an interaction firm-specific controls including industry, country, size, technology spending and an interaction term between term between industry and country. A variety of robustness checks have been performed (i.e., scaling revenue industry and country. A variety of robustness checks have been performed (i.e., scaling revenue growth by industry growth by industry averages, by previous growth rates and the results holds. Survey sample= 4,053 firms in 19 averages, by previous growth rates and the results holds. Survey sample= 4,053 firms in 19 industries and 23 industries and 23 countries. Revenue growth percentages have been rounded off to the nearest whole number. countries. Revenue growth percentages have been rounded off to the nearest whole number. Last FY implies the latest annual company financials reported before February 2022. Last FY implies the latest annual company financials reported before February 2022.
 Full Report Page 5 Page 7