
Infographic
Explore the interactive infographic to discover the untangled value of interoperability
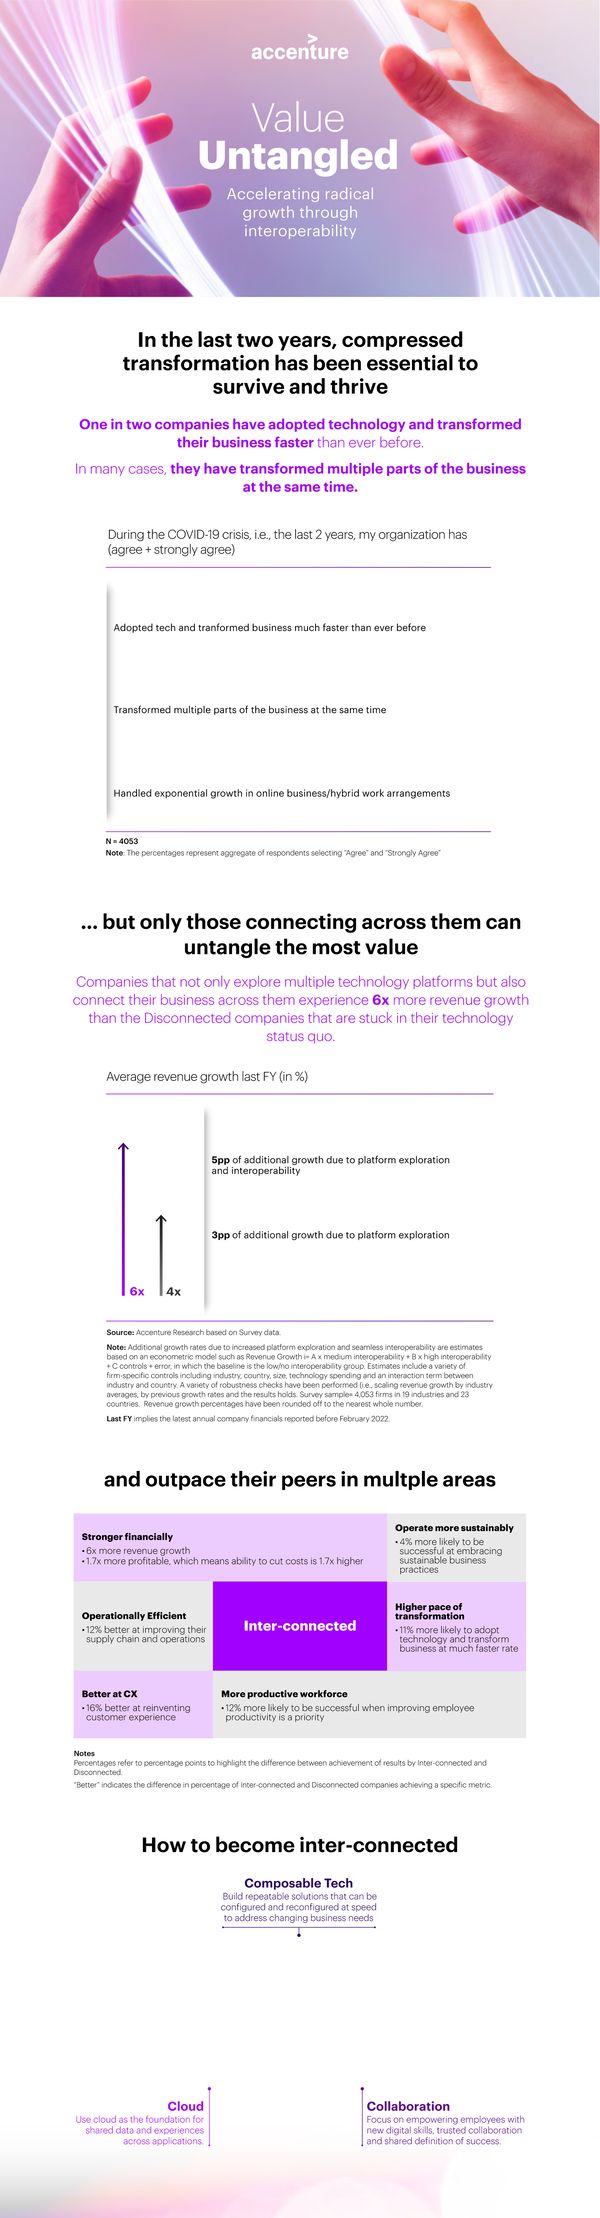
Value Untangled Accelerating radical growth through interoperability In the last two years, compressed transformation has been essential to survive and thrive One in two companies have adopted technology and transformed their business faster than ever before. In many cases, they have transformed multiple parts of the business at the same time. During the COVID-19 crisis, i.e., the last 2 years, my organization has (agree + strongly agree) Adopted tech and tranformed business much faster than ever before Transformed multiple parts of the business at the same time Handled exponential growth in online business/hybrid work arrangements N = 4053 Note: The percentages represent aggregate of respondents selecting “Agree” and “Strongly Agree” … but only those connecting across them can untangle the most value Companies that not only explore multiple technology platforms but also connect their business across them experience 6x more revenue growth than the Disconnected companies that are stuck in their technology status quo. Average revenue growth last FY (in %) 5pp of additional growth due to platform exploration and interoperability 3pp of additional growth due to platform exploration 6x 4x Source: Accenture Research based on Survey data. Note: Additional growth rates due to increased platform exploration and seamless interoperability are estimates based on an econometric model such as Revenue Growth i= A x medium interoperability + B x high interoperability +C controls + error, in which the baseline is the low/no interoperability group. Estimates include a variety of firm-specific controls including industry, country, size, technology spending and an interaction term between industry and country. A variety of robustness checks have been performed (i.e., scaling revenue growth by industry averages, by previous growth rates and the results holds. Survey sample= 4,053 firms in 19 industries and 23 countries. Revenue growth percentages have been rounded off to the nearest whole number. Last FY implies the latest annual company financials reported before February 2022. and outpace their peers in multple areas Stronger financially Operate more sustainably •6x more revenue growth •4% more likely to be successful at embracing •1.7x more profitable, which means ability to cut costs is 1.7x higher sustainable business practices Operationally Efficient Higher pace of Inter-connected transformation •12% better at improving their •11% more likely to adopt supply chain and operations technology and transform business at much faster rate Better at CX More productive workforce •16% better at reinventing •12% more likely to be successful when improving employee customer experience productivity is a priority Notes Percentages refer to percentage points to highlight the difference between achievement of results by Inter-connected and Disconnected. “Better” indicates the difference in percentage of Inter-connected and Disconnected companies achieving a specific metric. How to become inter-connected Composable Tech Build repeatable solutions that can be configured and reconfigured at speed to address changing business needs Cloud Collaboration Use cloud as the foundation for Focus on empowering employees with shared data and experiences new digital skills, trusted collaboration across applications. and shared definition of success.
 Infographic