
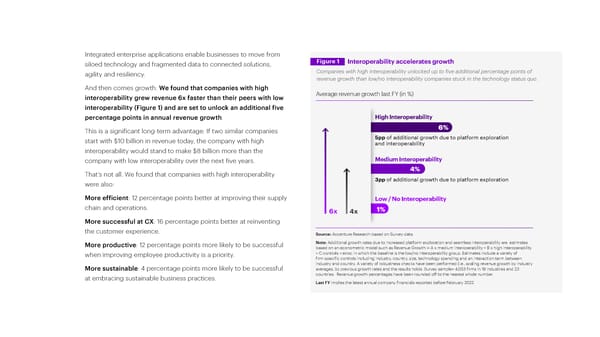
Integrated enterprise applications enable businesses to move from siloed technology and fragmented data to connected solutions, Figure 1 Interoperability accelerates growth agility and resiliency. Companies with high interoperability unlocked up to five additional percentage points of revenue growth than low/no interoperability companies stuck in the technology status quo. And then comes growth. We found that companies with high interoperability grew revenue 6x faster than their peers with low Average revenue growth last FY (in %) interoperability (Figure 1) and are set to unlock an additional five percentage points in annual revenue growth. High Interoperability This is a significant long-term advantage: If two similar companies 6% start with $10 billion in revenue today, the company with high 5pp of additional growth due to platform exploration and interoperability interoperability would stand to make $8 billion more than the company with low interoperability over the next five years. Medium Interoperability That’s not all. We found that companies with high interoperability 4% were also: 3pp of additional growth due to platform exploration More efficient: 12 percentage points better at improving their supply Low / No Interoperability chain and operations. 6x 4x 1% More successful at CX: 16 percentage points better at reinventing the customer experience. Source: Accenture Research based on Survey data. More productive: 12 percentage points more likely to be successful Note: Additional growth rates due to increased platform exploration and seamless interoperability are estimates based on an econometric model such as Revenue Growth i= A x medium interoperability + B x high interoperability when improving employee productivity is a priority. +C controls + error, in which the baseline is the low/no interoperability group. Estimates include a variety of firm-specific controls including industry, country, size, technology spending and an interaction term between industry and country. A variety of robustness checks have been performed (i.e., scaling revenue growth by industry More sustainable: 4 percentage points more likely to be successful averages, by previous growth rates and the results holds. Survey sample= 4,053 firms in 19 industries and 23 at embracing sustainable business practices. countries. Revenue growth percentages have been rounded off to the nearest whole number. Last FY implies the latest annual company financials reported before February 2022.
 Summary Page 3 Page 5