
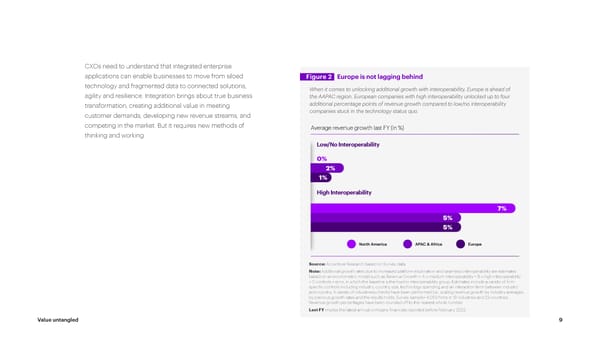
CXOs need to understand that integrated enterprise applications can enable businesses to move from siloed Figure 2 Europe is not lagging behind technology and fragmented data to connected solutions, When it comes to unlocking additional growth with interoperability, Europe is ahead of agility and resilience. Integration brings about true business the AAPAC region. European companies with high interoperability unlocked up to four transformation, creating additional value in meeting additional percentage points of revenue growth compared to low/no interoperability customer demands, developing new revenue streams, and companies stuck in the technology status quo. competing in the market. But it requires new methods of Average revenue growth last FY (in %) thinking and working. Low/No Interoperability 0% 2% 1% High Interoperability 7% 5% 5% North America APAC & Africa Europe Note: Revenue growth percentages have been rounded off to the nearest whole number. Source: Accenture Research based on Survey data. Additional growth rates due to increased platform exploration and seamless interoperability are estimates based Note: Additional growth rates due to increased platform exploration and seamless interoperability are estimates on an econometric model such as Revenue Growth = Ax medium interoperability + B x high interoperability+ C based on an econometric model such as Revenue Growth i= A x medium interoperability + B x high interoperability controls + error, in which the baseline is the low/no interoperability group. Estimates include a variety of + C controls + error, in which the baseline is the low/no interoperability group. Estimates include a variety of firm- firm-specific controls including industry, country, size, technology spending and an interaction term between specific controls including industry, country, size, technology spending and an interaction term between industry industry and country. A variety of robustness checks have been performed (i.e., scaling revenue growth by industry and country. A variety of robustness checks have been performed (i.e., scaling revenue growth by industry averages, averages, by previous growth rates and the results holds. Survey sample = 4,053 firms in 19 industries and 23 by previous growth rates and the results holds. Survey sample= 4,053 firms in 19 industries and 23 countries. Revenue growth percentages have been rounded off to the nearest whole number. countries. Revenue growth percentages have been rounded off to the nearest whole number. Last FY implies the latest annual company financials reported before February 2022. Last FY implies the latest annual company financials reported before February 2022. Value untangled 9
 Europe Page 8 Page 10