
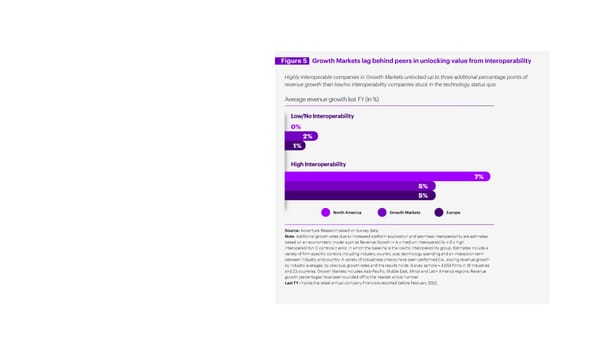
Figure 5 Growth Markets lag behind peers in unlocking value from interoperability Highly interoperable companies in Growth Markets unlocked up to three additional percentage points of revenue growth than low/no interoperability companies stuck in the technology status quo. Average revenue growth last FY (in %) Low/No Interoperability 0% 2% 1% High Interoperability 7% 5% 5% North America Growth Markets Europe Source: Accenture Research based on Survey data. Note: Additional growth rates due to increased platform exploration and seamless interoperability are estimates based on an econometric model such as Revenue Growth i= A x medium interoperability + B x high interoperability+ C controls + error, in which the baseline is the low/no interoperability group. Estimates include a variety of firm-specific controls including industry, country, size, technology spending and an interaction term between industry and country. A variety of robustness checks have been performed (i.e., scaling revenue growth by industry averages, by previous growth rates and the results holds. Survey sample = 4,053 firms in 19 industries and 23 countries. Growth Markets includes Asia-Pacific, Middle East, Africa and Latin America regions. Revenue growth percentages have been rounded off to the nearest whole number. Last FY implies the latest annual company financials reported before February 2022.
 Growth Markets Page 9 Page 11