
Growth Markets
Growth Markets (Asia-Pacific, Middle East, Africa and Latin America) perspective
Value untangled Amplify speed to value through interoperability Growth Markets (Asia-Pacific, Middle East, Africa and Latin America) perspective From insights to action, the path to extraordinary value starts here.
High growth economies can be technology-chaotic 03 Embracing agility in Growth Markets during uncertain times 08 Interoperability: the great unifier 09 Interoperability is now in reach 11 Liberty Holdings unlocks significant value from enterprise interoperability 12 Interoperability’s long-term cost 14 Contents HSBC revamps employee experience to enhance CX 16 Barriers to interoperability 18 How to improve interoperability and thrive in uncertainty 21 1. Leverage the Cloud 23 2. Utilize composable tech 24 3. Focus on meaningful collaboration 25 Interoperability: value untangled 28 Methodology 30
1. High growth economies can be technology-chaotic 2 3 4 5 6 High growth economies can be technology-chaotic
High growth economies like Asia-Pacific, Middle East, Africa Figure 1 Digital payments adoption is highest in Asia-Pacific and Latin America (Growth Markets) are faster to adopt Digital payments are used widely in Asia-Pacific despite low internet adoption. new technologies compared to other regions. This kind Digital Payment Adoption (2016 - 2020) of rapid growth typically leads to (or comes from) diverse investments in technology - centered around new ways of working and setting new performance frontiers. Software adoption has been higher in the Asia-Pacific region as compared to North America and Europe due to prominent in-country software stacks, like, Japan has had its own versions ranging from ERP, supply chain, HR systems to cloud for a long time. As a result, companies in Asia-Pacific inherit country-specific software environments as they expand across the region. This is unlike North America and Europe where companies usually work with global enterprise software providers. The Asia-Pacific region has also leapfrogged ahead of North America and Europe in the adoption of digital native technologies such as digital payments, social commerce (social media-based e-commerce), digital banking and ride sharing services. For example, in 2020 digital payment adoption rates in Asia-Pacific stood at close to 50%, 1 compared to less than 25% in North America and Europe (Figure 1). Source: World Bank, The Global Findex Database 2021, June 2022 Note: The numbers represent percentage of respondents using mobile phone or internet to make payments at least once a month.
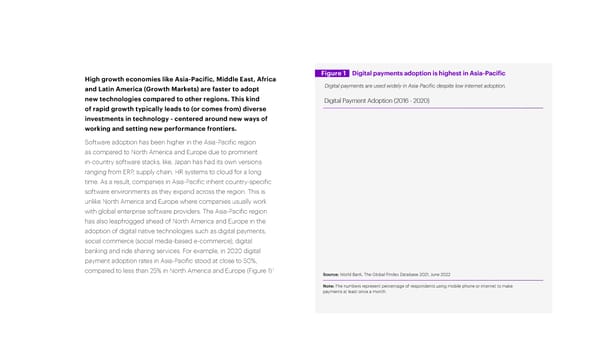
However, a digital payments boom has also led to an increase in fragmentation characterized by varying messaging standards, settlement times and operating hours. Payment preferences of users in the Asia-Pacific region vary greatly by country as each country in the region has its own regulations unlike large single markets in US, UK or Germany. As a result, there are multiple different payment solutions, ride hailing apps, messaging apps etc. in the region. For example, dominant e-wallets have a market share of around 90% in China, while credit cards are the popular choice in Singapore and Australia. The lack of interoperability across platforms in these markets curtail cross-border ecommerce opportunities.

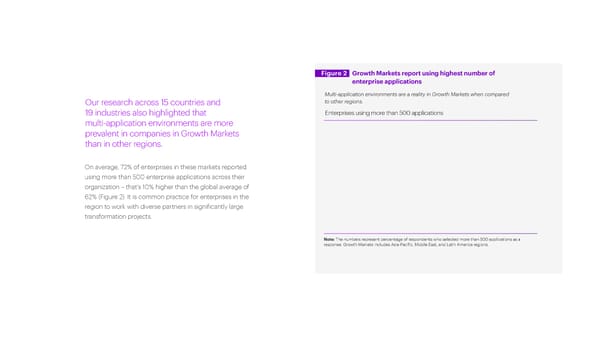
Figure 2 Growth Markets report using highest number of enterprise applications Multi-application environments are a reality in Growth Markets when compared Our research across 15 countries and to other regions. 19 industries also highlighted that Enterprises using more than 500 applications multi-application environments are more prevalent in companies in Growth Markets than in other regions. On average, 72% of enterprises in these markets reported using more than 500 enterprise applications across their organization – that’s 10% higher than the global average of 62% (Figure 2). It is common practice for enterprises in the region to work with diverse partners in significantly large transformation projects. Note: The numbers represent percentage of respondents who selected more than 500 applications as a response. Growth Markets includes Asia-Pacific, Middle East, and Latin America regions.
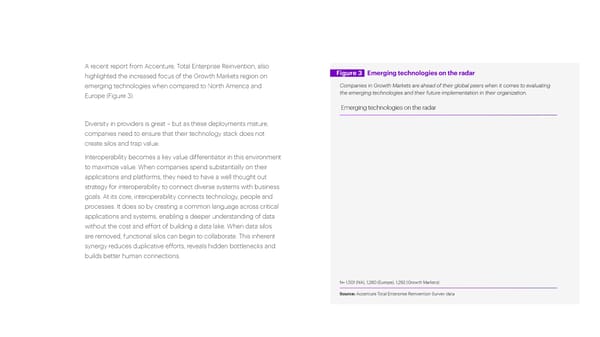
A recent report from Accenture, Total Enterprise Reinvention, also highlighted the increased focus of the Growth Markets region on Figure 3 Emerging technologies on the radar emerging technologies when compared to North America and Companies in Growth Markets are ahead of their global peers when it comes to evaluating Europe (Figure 3). the emerging technologies and their future implementation in their organization. Emerging technologies on the radar Diversity in providers is great – but as these deployments mature, companies need to ensure that their technology stack does not create silos and trap value. Interoperability becomes a key value differentiator in this environment to maximize value. When companies spend substantially on their applications and platforms, they need to have a well thought out strategy for interoperability to connect diverse systems with business goals. At its core, interoperability connects technology, people and processes. It does so by creating a common language across critical applications and systems, enabling a deeper understanding of data without the cost and effort of building a data lake. When data silos are removed, functional silos can begin to collaborate. This inherent synergy reduces duplicative efforts, reveals hidden bottlenecks and builds better human connections. N= 1,501 (NA), 1,260 (Europe), 1,292 (Growth Markets) Source: Accenture Total Enterprise Reinvention Survey data Note: The percentages represent the respondents that are “currently monitoring and screening the emerging technologies in their organization”. Growth Markets includes Asia-Pacific, Middle East, and Latin America regions.
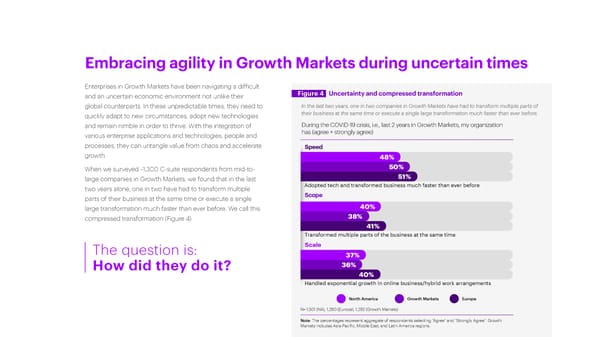
Embracing agility in Growth Markets during uncertain times Enterprises in Growth Markets have been navigating a difficult and an uncertain economic environment not unlike their Figure 4 Uncertainty and compressed transformation global counterparts. In these unpredictable times, they need to In the last two years, one in two companies in Growth Markets have had to transform multiple parts of quickly adapt to new circumstances, adopt new technologies their business at the same time or execute a single large transformation much faster than ever before. and remain nimble in order to thrive. With the integration of During the COVID-19 crisis, i.e., last 2 years in Growth Markets, my organization various enterprise applications and technologies, people and has (agree + strongly agree) processes, they can untangle value from chaos and accelerate Speed growth. 48% When we surveyed ~1,300 C-suite respondents from mid-to- 50% large companies in Growth Markets, we found that in the last 51% two years alone, one in two have had to transform multiple Adopted tech and transformed business much faster than ever before parts of their business at the same time or execute a single Scope large transformation much faster than ever before. We call this 40% 38% 40% compressed transformation (Figure 4). 41% Transformed multiple parts of the business at the same time The question is: Scale 37% How did they do it? 36% 40% Handled exponential growth in online business/hybrid work arrangements North America Growth Markets Europe N= 1,501 (NA), 1,260 (Europe), 1,292 (Growth Markets) Note: The percentages represent aggregate of respondents selecting “Agree” and “Strongly Agree”. Growth Markets includes Asia-Pacific, Middle East, and Latin America regions.
Interoperability: the great unifier We found that companies with this kind of agility And with that agility have one thing in common: high interoperability, comes growth. We found or the ability to make enterprise applications that companies with high Interoperability work in conjunction with each other. Why? interoperability in Growth defined Because interoperability integrates critical Markets grew revenue 2.5X business applications, turning tangled inputs faster than their peers with low Interoperability is when into a single source of data truth. This leaves interoperability (Figure 5) and enterprise applications can organizations better equipped to pivot quickly are set to unlock an additional easily interact with each and take advantage of new opportunities. three percentage points in other and exchange data. annual revenue growth. It A seamless user experience comes as no surprise, then, across applications creates that winning companies keep a single source of data interoperability top of mind for truth that aligns everyone the entire C-suite—not just the to common goals, leading CTO or CIO. to better decision making, human connections and insight generation.
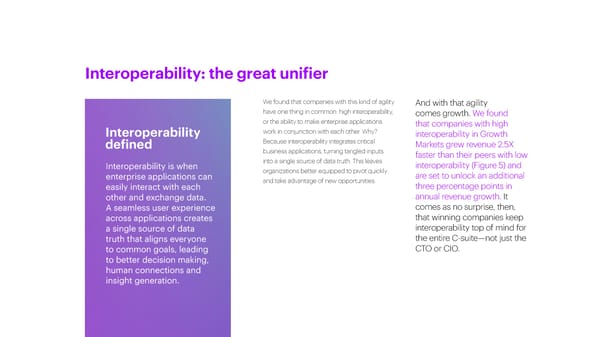
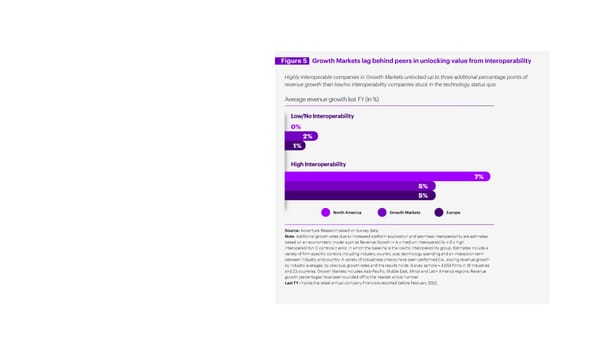
Figure 5 Growth Markets lag behind peers in unlocking value from interoperability Highly interoperable companies in Growth Markets unlocked up to three additional percentage points of revenue growth than low/no interoperability companies stuck in the technology status quo. Average revenue growth last FY (in %) Low/No Interoperability 0% 2% 1% High Interoperability 7% 5% 5% North America Growth Markets Europe Source: Accenture Research based on Survey data. Note: Additional growth rates due to increased platform exploration and seamless interoperability are estimates based on an econometric model such as Revenue Growth i= A x medium interoperability + B x high interoperability+ C controls + error, in which the baseline is the low/no interoperability group. Estimates include a variety of firm-specific controls including industry, country, size, technology spending and an interaction term between industry and country. A variety of robustness checks have been performed (i.e., scaling revenue growth by industry averages, by previous growth rates and the results holds. Survey sample = 4,053 firms in 19 industries and 23 countries. Growth Markets includes Asia-Pacific, Middle East, Africa and Latin America regions. Revenue growth percentages have been rounded off to the nearest whole number. Last FY implies the latest annual company financials reported before February 2022.
Interoperability is now in reach The concept of interoperability isn’t new, but Our research finds that the ability to manifest it is. This is due to three approximately one-third of technology changes that make it easier for companies (30.5%) in Growth organizations to configure and reconfigure Markets are capitalizing on applications as needed without overhauling these technological advances their digital core: to untangle the value trapped 1. Ubiquity of cloud: within their organization. These Many organizations have already moved to the companies are racing past their cloud, giving them a common data layer that competitors because they make provides a single source of truth. high interoperability central 2.Improved application design: to their overall business and Modern applications are designed to share technology strategy. data. They have simplified interfaces and support additional capabilities. 3. Low-cost applications: The large number of specialized applications on the market has reduced the cost.
This is a modal window.
Liberty Holdings unlocks significant value from enterprise interoperability Liberty Holdings2, a South Africa-based Using an API-led approach, Liberty’s developers financial services and insurance group, was were able to unlock data from back-end facing challenges due to the fact its claims, systems to build a digital platform with a single customer and underwriting data was stored comprehensive view of customers. This solution in multiple, monolithic back-end systems. features a digital claims portal that allows Liberty The result was a suboptimal insurance claims staff to quickly access critical customer and process that required employees to manually underwriting information, ultimately enabling extract data from seven different systems, them to process claims much faster. With new then enter it into a spreadsheet. They had to processes in place, the insurance company was then log into several other systems in order also able to expand its claims service beyond to process a claim. The operation was slow, traditional call centers to new digital channels, subject to human error and ultimately did reaching customers online and via mobile devices. not provide the level of support that Liberty’s Its customer service team could also finalize customers expect. in-progress claims through other channels. For example, if a customer starts a claim online and then needs assistance, a claims assistant can jump in and help without having to restart the whole process.
By automating the claims process and eliminating manual data entry and extraction, Liberty reduced claim processing time by up to 20 minutes per claim. Moreover, an impressive API reuse rate of 40% has increased the software delivery speed of Liberty’s development team. For example, during the COVID-19 pandemic, Liberty was able to roll out services to customers via WhatsApp within weeks, instead of months, by reusing existing architecture and focusing resources on front-end development.

This is a modal window.
1 2. Interoperability’s long-term cost 3 4 5 6 Interoperability’s long-term cost

HSBC revamps employee experience to enhance CX 3 When HSBC needed to improve employee experiences and deliver enhanced services, they found that legacy HR processes had grown complex and fragmented across different countries. The bank’s transformation program required more agile and interoperable systems. As a result, HSBC decided to use digital HR solutions from SAP, ServiceNow and MuleSoft to achieve its objective. Legacy HR performance and compensation accessible for employees. It also empowered systems, manual processes for talent and both HR and IT to focus on services and succession management and payroll were replaced innovation rather than expensive and complex with SAP SuccessFactors, an integrated, cloud- maintenance and upgrades to existing legacy based HR software application. ServiceNow added systems. The bank was able to improve core an employee engagement layer, including a portal, services like payroll, workforce administration, knowledge management and case management. employee data management and HSBC also needed to integrate these multitude of communications. At the same time, improved global and regional applications, data and devices to access to data and insights will help leaders ensure seamless HR workflows. to leverage the bank’s talent and make better The transformation exercise helped HSBC decisions about their teams and people. streamline HR processes, making services more
Building on this foundation, the bank has developed a market-leading skills infrastructure including a learning experience platform using Degreed and a talent marketplace using Gloat. These capabilities help employees access new learning and opportunities to gain experiences across the bank, while helping the bank develop the capabilities it needs to improve client experience and transform the bank for the future including in areas like wealth, sustainable finance and digital.


1 2 3. Barriers to interoperability 4 5 6 Barriers to interoperability
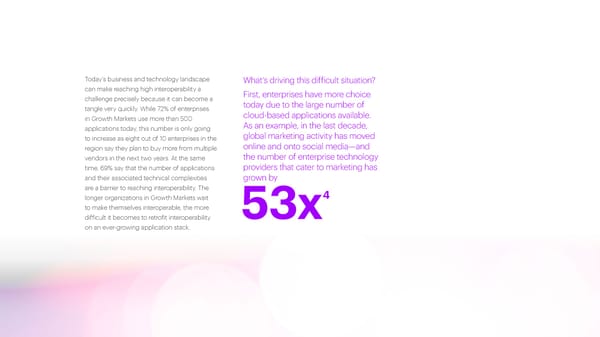
Today’s business and technology landscape What’s driving this difficult situation? can make reaching high interoperability a First, enterprises have more choice challenge precisely because it can become a today due to the large number of tangle very quickly. While 72% of enterprises cloud-based applications available. in Growth Markets use more than 500 As an example, in the last decade, applications today, this number is only going global marketing activity has moved to increase as eight out of 10 enterprises in the region say they plan to buy more from multiple online and onto social media—and vendors in the next two years. At the same the number of enterprise technology time, 69% say that the number of applications providers that cater to marketing has and their associated technical complexities grown by are a barrier to reaching interoperability. The 4 longer organizations in Growth Markets wait to make themselves interoperable, the more 53x difficult it becomes to retrofit interoperability on an ever-growing application stack.
This is a modal window.
The second key factor is that more voices are Our research also highlighted that 62% of involved in technology decision making. IDC, respondents in Growth Markets are held back from an industry analyst firm, believes that as many improving interoperability because they struggle to as 20 IT and line-of-business employees may align their application strategy with overall business be involved in technology decision-making goals. Another 59% cite lack of buy-in from senior processes today.5 leadership; 45% lack a clear ROI or business case; But having more choices and more voices and 33% believe interoperability is simply too can be a great thing. It allows organizations to expensive. choose tech with the right features for specific Companies with high interoperability also face these processes and differentiate across functions challenges. But what sets them apart is their ability to where it matters. For example, fraud detection cope with obstacles by finding alignment across the applications in Banking need to be much more business, acting early and making difficult decisions sophisticated than those in Food Retail. And as needed. They build and reinforce technology in Healthcare, applications need the strongest integration with meaningful collaboration—intrinsic data and privacy measures given the sensitive to employees’ work life. And, most importantly, they data they handle. Similarly, Consumer Goods back up their diverse application stacks with the companies need applications to enable near right business strategy. One that is conscious of real-time social media monitoring so that they the organization’s full universe of applications and can launch new products and adjust current vendor selection style and recognizes the limitations ones as trends quickly change or emerge. of the IT team.
1 2 3 4. How to improve interoperability and thrive in uncertainty 5 6 How to improve interoperability and thrive in uncertainty
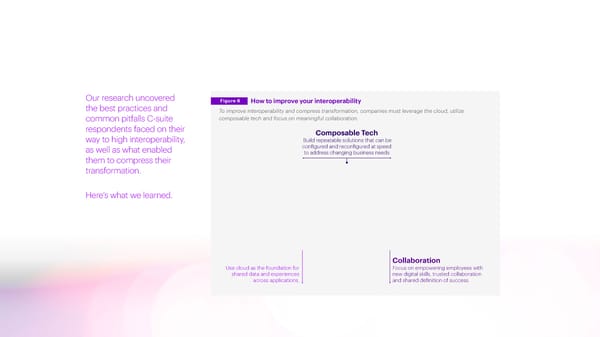
Our research uncovered Figure 6 How to improve your interoperability the best practices and To improve interoperability and compress transformation, companies must leverage the cloud, utilize common pitfalls C-suite composable tech and focus on meaningful collaboration. respondents faced on their Composable Tech way to high interoperability, Build repeatable solutions that can be as well as what enabled configured and reconfigured at speed to address changing business needs them to compress their transformation. Here’s what we learned. Collaboration Use cloud as the foundation for Focus on empowering employees with shared data and experiences new digital skills, trusted collaboration across applications. and shared definition of success.
1. Leverage the cloud Cloud is a fundamental interoperability enabler— Companies with high interoperability also use Procurement, Projects, and Integration Cloud. This and it’s now ubiquitous. Organizations can use it to the cloud to change the way they work. They move helped Coronado introduce a new supplier hyperscale computing in their core operations and aim to standardize and simplify the processes portal and streamline operations by removing the at the edges. With this ability, organizations can pull modern cloud applications manage—enabling delay for the purchasing team to update supplier and query data across the entire enterprise. real-time insights and creating strategic information. In addition to getting more functionality Companies that successfully improve their agility. Interoperability like this breaks down from their cloud investment, Coronado is reducing interoperability start by moving existing applications organizational silos and creates a common costs and improving efficiencies each year. to the cloud and investing in new, cloud-based thread so that change initiatives can flow to The high interoperability group’s confidence enterprise applications (SaaS). But more importantly, different parts of the organization in parallel, in the cloud reinforces findings from our 2021 they use the cloud to connect data and and at speed. thought leadership piece, the Cloud Continuum: experiences across applications, creating one Consider Australia-based metals & mining organizations that use cloud beyond migration and version of truth. Our research found that nearly 6 company, Coronado Global Resources. The infrastructure to reinvent themselves enjoy better 70% of companies in Growth Markets with high/ company moved its legacy ERP, HCM and cost savings, speed to market, talent retention and medium interoperability adopted public cloud and supply chain management to Oracle cloud. sustainability. have already migrated more than 30% of their data Initially envisioned as a “lift and shift” of Oracle and workloads. Only 57% of low/no interoperability E-Business Suite (EBS), it transformed into companies have adopted public cloud, a 13% lag. a comprehensive program encompassing
2.Utilize composable tech Composable Composable tech builds flexibility into the heart entire organization so everyone is on the same tech defined of organizations so they can cope with the page, creating a common purpose and driving Composable tech is an effects of disruption through faster, better and better decisions. approach that uses proven, cheaper transformation. It requires shifting from a As multi-application and multi-provider repeatable solutions that technology architecture of static, standalone parts deployments are prevalent in Growth Markets, can be configured and to one of composable pieces. composable tech can help enterprises easily reconfigured at speed to In practice, this involves using prebuilt, integrate a large number of applications, people, address changing business interoperable solutions to swap and plug-and- processes and data to create a seamless digital needs. This compresses play smaller application components, creating experience for their customers, as well as their transformation, setting new applications without wider disruption. These employees. In fact, composable tech is the natural the stage for rapid value solutions are often curated for specific industries next step from component-based architecture realization. and functions and act as a form of future prevalent in the region. Due to vast diversity across proofing—giving organizations the dexterity to the region, enterprises in Growth Markets regularly quickly adopt the technologies of tomorrow. design architectures in such a manner that the However, the greatest benefit of composable tech core system of record is common across multiple may be seamless data analysis and sharing. With countries while last mile systems such as logistics, data flowing between connected applications, payroll and payments are local to each country. companies can easily share information with the
3.Focus on meaningful collaboration Any transformation that doesn’t include people is bound to fail—interoperable applications are only one part of the equation. Companies need to also focus on building meaningful collaboration. This is enabled by interoperability and happens when functions and people work together seamlessly towards a common goal. They can use real-time data, analytics and AI, together with new ways of working, to unlock the value of technology, empower people and achieve better outcomes.
Companies with high interoperability have an unwavering focus on improving human connections with trust and skills. They continuously invest in pervasive training, empowering IT and non-IT decision makers to make sound application choices. They also build data-sharing mindsets to prevent data hoarding. Companies with high interoperability are open to sharing data inside and outside the organization. Decentralized data—where everyone is on the same page—helps companies find harmony. The result is happier, more productive employees who can easily use company data to produce meaningful results, prepare presentations, comply with regulations or simply collaborate. Decentralized data also frees up almost two hours of an employees’ workday in productivity alone. For a company that has 10,000 employees, this amounts to a productivity gain of almost 15,000 7 hours and $100 million every year.
This is a modal window.
A collaborative culture comes from the top: our research Accenture has also enabled the introduction found that more than one fourth (27%) of executives in of new capabilities, automation and business Growth Markets consider a lack of collaboration across processes – all without leaving Teams. It also business functions as a top challenge caused by low/ introduced extra services, such as using bots no interoperability. Leadership can amplify collaboration to answer people’s queries more quickly. One by drawing up broad use cases for new interoperable example, CALM (CAL + Machine), is a custom applications and challenging employees across functions to app embedded in Teams that delivers in- solve them as a team—an internal hackathon of sorts. context insights, such as financial filings or Accenture8 uses Microsoft Teams to accelerate the art Twitter news, to Client Account Leads (CALs). of collaboration. Using Teams as-a-platform brings tools, content and processes together in a single location to enable a new way of working. Accenture has been able to bring data, insights and services together as part of its digital worker program that involves foundational technology, productivity and collaboration.

1 2 3 4 5. Interoperability: Value untangled 6 Interoperability: Value untangled
Companies in Growth Markets need to be able to But building and improving interoperability in a diverse anticipate and respond to uncertainty—supply shocks, application landscape is easier said than done. Luckily, economic disruptions, competitive threats or new there are ways to position your company for success: growth opportunities—as it happens, not when the leverage the cloud, utilize composable tech, and finally, opportunity has passed. focus on meaningful collaboration with decentralized By compressing their transformation from years to data and capabilities. months (or even days) and transforming multiple About one-third of companies in Growth parts of the business simultaneously, companies can Markets are able to develop this level overcome obstacles and embrace opportunities. of agility to untangle the value trapped This only happens when everything is integrated and in their organization, racing past their interoperable, from the diverse technologies that competitors in growth, efficiency power the business to the employees on the ground. and resiliency. Their secret? Using More so in Growth Markets, as enterprises in the region interoperability as the catalyst for total use a higher number of applications across their enterprise reinvention. organizations as compared to other regions.
This is a modal window.
1 2 3 4 5 6. Methodology Methodology
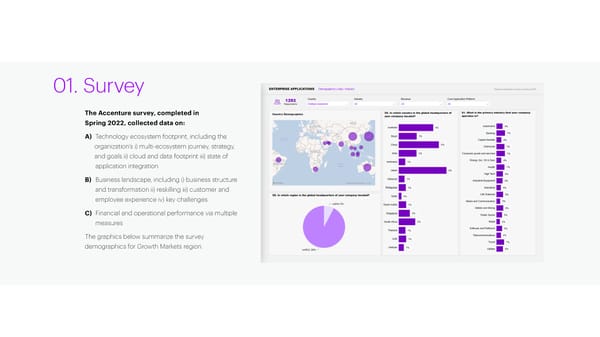
01. Survey The Accenture survey, completed in Spring 2022, collected data on: A) Technology ecosystem footprint, including the organization’s i) multi-ecosystem journey, strategy, and goals ii) cloud and data footprint iii) state of application integration B) Business landscape, including i) business structure and transformation ii) reskilling iii) customer and employee experience iv) key challenges. C) Financial and operational performance via multiple measures The graphics below summarize the survey demographics for Growth Markets region.
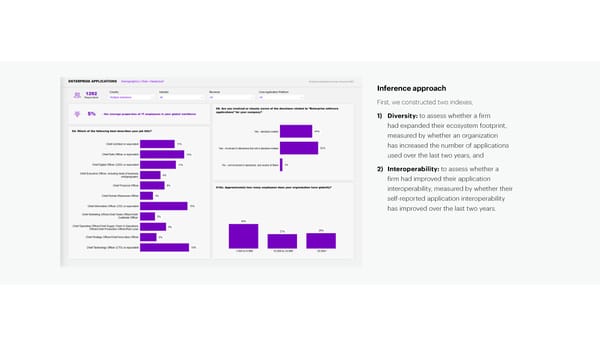
Inference approach First, we constructed two indexes, 1) Diversity: to assess whether a firm had expanded their ecosystem footprint, measured by whether an organization has increased the number of applications used over the last two years, and 2) Interoperability: to assess whether a firm had improved their application interoperability, measured by whether their self-reported application interoperability has improved over the last two years.
Using these two indexes as dummy variables, interoperability), and finally, one that was leading in we grouped all global 4,053 as well as 1,292 terms of both ecosystem expansion and integration respondents in Growth Markets into three groups. across these ecosystems (companies with high The first group, which had not improved Diversity interoperability). We then investigated how being in over the last two years, regardless of their each group correlates to measures of performance. Interoperability score, was named companies with low/no interoperability. The second group, Calculation of the which had improved Diversity but not improved its performance difference Interoperability was called companies with medium interoperability. The remaining respondents, Using the definitions above, we compared the who had improved both their Diversity and difference in performance between these three Interoperability were named high interoperability. groups—with metrics such as cost savings, revenue In Growth Markets, each group had roughly a growth, employee productivity, and how successful third of the respondents (~33%, or ~430). In other they have been at achieving business goals such words, we identified three equal sized groups as reinventing customer experience and achieving of companies, one of which was in ecosystem efficiency in supply chain operations. stasis (companies with low/no interoperability), one that was expanding ecosystems but not improving integration (companies with medium
02.Interviews and Case Studies We triangulated our findings from the survey’s large- scale global primary data with 25 in-depth interviews and 40 case studies. Overall, we collected through secondary research and interviews about 65 case studies focusing on issues organizations are facing on their multi-ecosystem journey and the evolution of organizations toward the multi-ecosystem world. To analyse the qualitative data (QDA) of the 25 in- depth interviews, we leveraged ATLAS.ti9, a tool that accelerates the QDA by automatically generating deep insights across the interview transcripts.
03. Collective Intelligence via an Enterprise Crowdsourcing Platform To understand the organizational and human thoughts others have provided on a scale of one implications of multiple ecosystems, we used to five stars, and viewed how the thoughts in the 10 ThoughtExchange , a qualitative platform exchange were rated by the group. designed to bring people together on important topics and gain their collaborative insights. Thirty- five C-suite participants were asked to share their Through this process, we aimed to ideas in response to an open-ended question on surface the practices that are top- how their organization increases cross-functional of-mind for C-suite executives as a alignment (organizational impact of integration) collaborative effort and enrich our while preserving the unique features of each storyline. function (organizational impact of diversity). Participants shared their own ideas, rated the
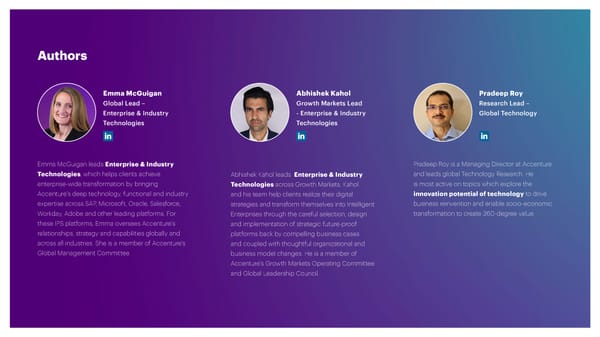
Authors Emma McGuigan Abhishek Kahol Pradeep Roy Global Lead – Growth Markets Lead Research Lead – Enterprise & Industry - Enterprise & Industry Global Technology Technologies Technologies Emma McGuigan leads Enterprise & Industry Pradeep Roy is a Managing Director at Accenture Technologies, which helps clients achieve Abhishek Kahol leads Enterprise & Industry and leads global Technology Research. He enterprise-wide transformation by bringing Technologies across Growth Markets. Kahol is most active on topics which explore the Accenture’s deep technology, functional and industry and his team help clients realize their digital innovation potential of technology to drive expertise across SAP, Microsoft, Oracle, Salesforce, strategies and transform themselves into Intelligent business reinvention and enable socio-economic Workday, Adobe and other leading platforms. For Enterprises through the careful selection, design transformation to create 360-degree value. these IPS platforms, Emma oversees Accenture’s and implementation of strategic future-proof relationships, strategy and capabilities globally and platforms back by compelling business cases across all industries. She is a member of Accenture’s and coupled with thoughtful organizational and Global Management Committee. business model changes. He is a member of Accenture’s Growth Markets Operating Committee and Global Leadership Council.
References 1 World Bank, The Global Findex Database 2021, June 2022 (https://www.worldbank.org/en/publication/globalfindex) 2 Liberty saves millions of dollars using API-led connectivity: https://www.mulesoft.com/case-studies/api/liberty-holdings 3 HSBC revamps HR services and employee experience https://www.accenture.com/us-en/case-studies/financial-services/hsbc-hr-services-employee-experience 4 Marketing Technology Landscape 2022: https://chiefmartec.com/2022/05/marketing-technology-landscape-2022-search-9932-solutions-on-martechmap-com 5 Digital Innovation Requires Enterprise Application Vendors to Focus on What Matters: https://blogs.idc.com/2021/01/08/digital-innovation-requires-enterprise- application-vendors-to-focus-on-what-matters/ 6 Mining a competitive edge on Oracle Cloud https://www.accenture.com/in-en/case-studies/natural-resources/mining-competitive-edge-oracle-cloud 7 Based on average wages per hour data from US Bureau of Labor Statistics (https://www.bls.gov/news.release/empsit.t19.htm). Calculation: Productivity gain with interoperability x Average hours worked per day per employee (8 hrs) x No. of employees (10,000) x No. of working days in a year (260) x Average wages per hour ($32 as of June 2022 per US Bureau of Labor Statistics) 8 Transforming the employee experience with Teams https://www.accenture.com/us-en/case-studies/about/migrating-microsoft-teams 9 ATLAS.ti: https://atlasti.com/ 10 ThoughtExchange: https://thoughtexchange.com/about/
About Accenture About Accenture Research Accenture is a leading global professional services company that helps the world’s leading Accenture Research creates thought leadership about the most pressing business businesses, governments and other organizations build their digital core, optimize their issues organizations face. Combining innovative research techniques, such as data operations, accelerate revenue growth and enhance citizen services—creating tangible value science led analysis, with a deep understanding of industry and technology, our team at speed and scale. We are a talent and innovation led company with 738,000 people serving of 300 researchers in 20 countries publish hundreds of reports, articles and points clients in more than 120 countries. Technology is at the core of change today, and we are one of view every year. Our thought-provoking research developed with world leading of the world’s leaders in helping drive that change, with strong ecosystem relationships. We organizations helps our clients embrace change, create value, and deliver on the combine our strength in technology with unmatched industry experience, functional expertise power of technology and human ingenuity. and global delivery capability. We are uniquely able to deliver tangible outcomes because of For more information, visit www.accenture.com/research. our broad range of services, solutions and assets across Strategy & Consulting, Technology, Operations, Industry X and Accenture Song. These capabilities, together with our culture of shared success and commitment to creating 360° value, enable us to help our clients succeed and build trusted, lasting relationships. We measure our success by the 360° value we create for our clients, each other, our shareholders, partners and communities. Visit us at www.accenture.com. This document makes descriptive reference to trademarks that may be owned by others. Copyright © 2023 Accenture. The use of such trademarks herein is not an assertion of ownership of such trademarks All rights reserved. by Accenture and is not intended to represent or imply the existence of an association Accenture and its logo are registered between Accenture and the lawful owners of such trademarks. trademarks of Accenture.
Endnotes