
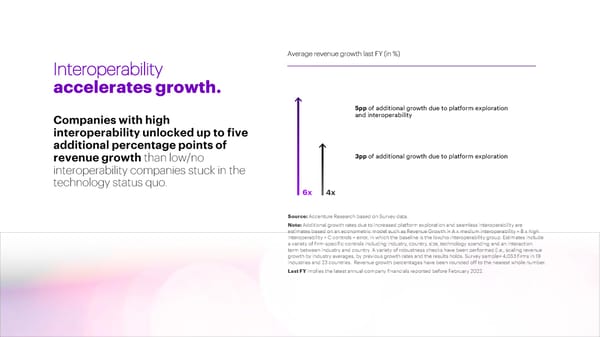
Companies with high interoperability unlocked up to five additional percentage points of revenue growt h than low/no interoperability companies stuck in the technology status quo. Interoperability accelerates growth. Average revenue growth last FY (in %) 4x 6x 5pp of additional growth due to platform exploration and interoperability 3pp of additional growth due to platform exploration ata. Source: Accenture Research based on Survey d Note: Additional growth rates due to increased platform exploration and seamless interoperability are estimates based on an econometric model such as Revenue Growth i= A x medium interoperability + B x high teroperability + C controls + error, in which the baseline is the low/no interoperability group. Estima in tes include a variety of firm-specific controls including industry, country, size, technology spending and an interaction term between industry and country. A variety of robustness checks have been performed (i.e., scaling revenue growth by industry averages, by previous growth rates and the results holds. Survey sample= 4,053 firms in 19 industries and 23 countries. Revenue growth percentages have been rounded off to the nearest whole number. Last FY implies the latest annual company financials reported before February 2022.
 Microsite Page 5 Page 7